An average mortgage origination volume chart Template is most useful when it turns a large mortgage-production dataset into a consistent visual record of lending activity. The underlying measure can be expressed as dollars originated, loans originated, or both. Because those measures answer different questions, a strong template begins by defining exactly what is being measured, which borrowers or properties are included, and whether the reporting period is monthly, quarterly, or annual.
The practical search intent behind this topic is usually straightforward: readers want a repeatable chart structure that can accept mortgage origination data, calculate an average, show changes over time, and communicate the result without requiring a new design for every reporting cycle. A well-designed worksheet can therefore serve lenders, mortgage analysts, finance teams, researchers, consultants, and housing-market professionals who need a consistent way to monitor production.
Official mortgage data demonstrates why these definitions matter. The Consumer Financial Protection Bureau reports both the number and dollar volume of new mortgages and distinguishes aggregate monthly observations from seasonally adjusted series. Mortgage Bankers Association research also reports average total origination volume in both dollar and loan-count terms. These measures should not be blended into one statistic without clear labeling because a change in average loan size can make dollar volume rise even when loan counts move much less.

What an average mortgage origination volume chart should measure
Mortgage origination volume generally describes the amount or number of new mortgage loans originated during a specified period. A dollar-volume chart answers a production question: how much mortgage credit was originated? A loan-count chart answers an activity question: how many loans were originated? An average measure can then be calculated from those observations, but the formula depends on the intended analysis.
For example, suppose a lender reports quarterly production of $400 million, $500 million, $450 million, and $650 million. The simple arithmetic average is $500 million per quarter. If the same lender reports 1,000, 1,100, 900, and 1,300 loans during those periods, the average loan count is 1,075 loans per quarter. Neither average should be presented as a universal market average because it describes only the selected observations and population.
For a market-level chart, the analyst should also distinguish between an average of observations and an average loan size. Average quarterly origination volume is calculated across periods. Average loan size is usually calculated by dividing total originated dollars by total originated loans for the relevant population. Those calculations can produce very different interpretations, especially when mortgage activity shifts toward larger or smaller loans.

A useful chart therefore begins with a small data dictionary. The dictionary should identify the period, total dollar volume, purchase volume, refinance volume, loan count, average loan size, source, geographic scope, property scope, and whether each observation is historical or projected. Keeping these fields separate makes the template easier to audit and prevents a future user from accidentally replacing a dollar measure with a count measure.
Why purchase and refinance volume should be separated
Purchase and refinance activity behave differently because their economic drivers are different. Purchase production is closely connected with home sales, house prices, inventory, affordability, borrower demand, and financing conditions. Refinance production is much more sensitive to the relationship between current mortgage rates and the rates already held by existing borrowers. A chart that combines the two without segmentation can conceal important changes in market composition.
The sharp refinancing cycle around 2020 and 2021 is a useful example. Very low mortgage rates encouraged large numbers of homeowners to refinance, producing unusually high refinance volumes. As rates moved higher, refinancing contracted substantially. A total-volume chart can show the decline, but a stacked purchase-versus-refinance chart explains why the composition changed.
For that reason, a practical template can use three primary series: total origination volume, purchase volume, and refinance volume. If the source supplies only two components, total volume can be calculated as the sum of purchase and refinance volume where the definitions are compatible. If other-purpose loans are included, they should remain visible rather than silently disappearing from the calculation.

The visual hierarchy should make total activity easy to identify while allowing the reader to see the components. Stacked columns are useful when the objective is to show composition. Grouped columns are better when the objective is to compare purchase and refinance volumes directly. A line can be added for an average benchmark when the chart needs to show whether each period is above or below the historical average.

Choosing the correct time period
Monthly charts provide the greatest detail but can become visually crowded over several years. Quarterly charts often provide a useful compromise for management reporting because they preserve seasonality while reducing the number of observations. Annual charts are easier to read and are especially useful for long historical comparisons, forecasts, strategic planning, and market-cycle analysis.
The selected period should match the business question. A lender reviewing production capacity may want monthly observations because staffing and operational expenses can change quickly. A strategic planning team may prefer quarterly observations because the objective is to identify broader market direction. A researcher studying long-term mortgage cycles may use annual observations spanning decades.
Seasonality also matters. Mortgage lending does not necessarily behave uniformly throughout a calendar year. If a template compares January with December without considering seasonal patterns, the difference may be interpreted incorrectly. A seasonally adjusted series can help with some analytical purposes, while an unadjusted series is often preferable when the goal is to show actual reported production during each period.

A good template should therefore contain a period-frequency field rather than assuming that every dataset is annual. It should also preserve the original date or quarter labels from the source. Converting dates manually can introduce errors, particularly when fiscal quarters and calendar quarters are not aligned.
Building the data structure behind the chart
The underlying worksheet should be organized in a simple rectangular structure. Each row should represent one observation, while each column represents one variable. A basic structure might contain Period, Total Volume, Purchase Volume, Refinance Volume, Loan Count, Average Loan Size, Market Segment, Source, and Data Status.
The source column is particularly important for professional reporting. Mortgage data can come from regulatory datasets, industry surveys, company disclosures, research organizations, or internal production systems. Two sources can describe similar concepts while using different populations or definitions. Recording the source next to each observation makes later reconciliation substantially easier.
The data-status field can distinguish historical observations from estimates and forecasts. This matters because a chart that places projected values directly beside confirmed historical values can make them appear equally certain. A different marker, pattern, or label should be used when forecasts are included.

Another important field is the unit. Dollar volume should be explicitly identified as dollars, millions, or billions. Loan counts should be identified as individual loans or thousands of loans. Average loan size should normally be displayed separately from total origination volume so that the reader does not confuse the two.

How to calculate the average correctly
The simplest average of periodic origination volume is the arithmetic mean. If the observations are V1 through Vn, the average is the sum of those observations divided by the number of observations. This is appropriate when the analytical question is, “What was the typical period in this selected series?” It does not automatically represent a typical mortgage loan or a weighted market average.
For example, if annual origination volume is $1.2 trillion, $1.5 trillion, $1.8 trillion, $1.4 trillion, and $2.1 trillion, the five-year arithmetic average is $1.6 trillion. The result should be labeled as the average annual origination volume for that five-year observation window. It should not be described simply as “the average mortgage” because that would imply a different calculation.
Average loan size uses a different formula. Total originated dollars are divided by the number of originated loans. This is a weighted result because every loan contributes its actual balance to the total. It is generally more meaningful than averaging individual loan-size observations when the underlying dataset contains different numbers of loans in each period.
The distinction becomes important when comparing market periods. A period with fewer loans but substantially larger balances can have high dollar origination volume without having high origination counts. A professional chart should allow the reader to understand whether growth came from more loans, larger loans, or both.
How to design the chart itself
A clear chart should have a descriptive title, a labeled horizontal axis, a labeled vertical axis, a unit, and a concise legend. The title should identify the population and period. Instead of a vague title such as “Mortgage Volume,” a stronger title might specify “Quarterly U.S. Single-Family Mortgage Origination Volume, Purchase and Refinance.”
The vertical axis should use sensible units. Showing $1,500,000,000,000 on every tick mark creates unnecessary visual complexity. If the series is reported in billions, retain billions throughout the chart. If the underlying data are in millions, convert them consistently before charting rather than mixing units.
Color should be used consistently. If purchase volume is represented by one color, it should retain that identity across every reporting period and related chart. Refinance should have its own stable visual identity. Total volume can be shown through a stacked total, a separate line, or a clearly labeled annotation.
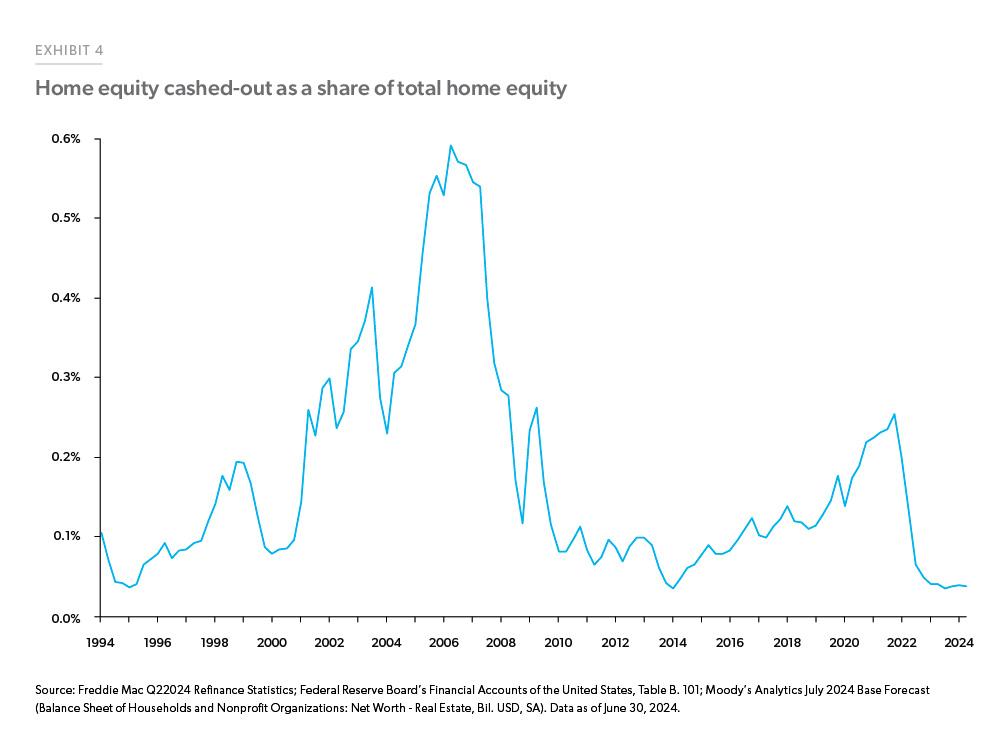
A benchmark line can make an average mortgage origination volume chart Template much more informative. For instance, a horizontal line can show the arithmetic average of all historical periods in the selected window. The reader can then identify above-average and below-average periods immediately. The benchmark must state exactly which periods were used to calculate it.
Using forecasts without misleading the reader
Forecasts are useful when a chart is intended for planning, but historical and projected data should be visually distinguishable. Mortgage forecasts are assumptions about future market conditions, not guarantees. Forecasts can change when mortgage rates, housing activity, prices, credit conditions, or economic expectations change.
For example, MBA has published forecasts showing expected changes in total mortgage origination volume and loan counts. Fannie Mae also publishes mortgage-originations forecasts that separate purchase and refinance activity. These sources are useful examples of how professional charts distinguish historical observations from forecast periods.
A template should therefore contain a forecast-status column and preferably a visual boundary between actual and projected periods. The word “Forecast” can appear above the projected section, while a different bar pattern or marker can reinforce the distinction. Historical values should never be replaced merely because a newer forecast exists.
Comparing dollar volume with loan counts
One of the most useful features of a mortgage origination template is the ability to display both dollar volume and loan count. A rise in dollar production can be caused by more transactions, larger average balances, or a combination of both. Without loan counts, the chart cannot explain which mechanism is responsible.
Suppose a hypothetical lender increases annual production from $1 billion to $1.2 billion while loan count rises from 4,000 to 4,100. The increase in dollar volume is much larger than the increase in loan count, suggesting that average balances have risen materially. Conversely, if production increases from $1 billion to $1.2 billion while loan count increases from 4,000 to 5,000, the growth story is more heavily driven by transaction volume.
This distinction is especially important during periods of elevated home prices. Higher property values can increase loan balances even when the number of financed transactions remains subdued. A chart that shows only dollars may therefore make a market appear stronger than the underlying transaction count suggests.

Using spreadsheet-based workflows
A spreadsheet is well suited to this analysis because the source data, formulas, charts, and validation checks can remain together. The most useful layout separates raw observations from calculations. A raw-data area should preserve source values exactly, while a calculation area can convert units, calculate averages, derive shares, and create chart-ready fields.
For a chart built in Excel, the source range should preferably be structured as a formal data table so that new rows can be incorporated more easily. A pivot-based chart can be useful when the data include multiple lenders, states, loan purposes, or product types. The important point is to keep the source dimensions intact rather than creating a separate chart dataset that has to be rebuilt manually every reporting period.
A Google Sheets workflow follows the same principle. The data tab can contain the observations, the calculation tab can contain formulas, and the presentation tab can contain the final chart. This separation reduces the chance that a formatting change will accidentally alter the underlying calculations.

Choosing between spreadsheet, document, and PDF formats
An Excel-oriented structure is generally the most flexible when calculations and chart updates are required. A Google Sheets structure is useful when several analysts need to work on the same dataset. A Google Docs or Word-oriented version is more appropriate when the chart is part of a narrative report rather than a calculation workbook.
A PDF layout is valuable when the objective is distribution or archival presentation. It is not ideal as the primary calculation environment because the chart becomes a presentation artifact rather than an editable analytical model. A printable version can still be produced from the same underlying data after the analysis is complete.
For readers searching for an average mortgage origination volume chart template pdf, the most important consideration is whether the document is intended for viewing or calculation. A static PDF can communicate the final analysis effectively, but the source data should remain in a structured format elsewhere if the report will be updated regularly.
Regional and market segmentation
National mortgage volume can hide large differences between markets. A regional template can include state, metropolitan area, lender market, or property segment as additional dimensions. The chart should then use filters or separate views rather than placing dozens of regions on one crowded graph.
The CFPB’s origination activity data include geographic comparisons, illustrating how mortgage production can be analyzed beyond the national level. A regional chart should preserve the same definition of origination volume across every geography. Otherwise, a difference between regions may simply reflect inconsistent data definitions.
For a UK-focused report, the same principles apply, although the underlying market terminology, institutions, data series, and reporting conventions differ from U.S. mortgage datasets. A search for an average mortgage origination volume chart template uk should therefore be treated as a request for a localized presentation framework, not as evidence that U.S. figures can simply be transferred into a UK chart.

Common mistakes when building the chart
The first common mistake is mixing loan counts and dollar volume. A chart may label the axis “Volume” while some rows represent loans and others represent dollars. This produces an apparently polished chart that is analytically meaningless. Every series should have a clearly defined unit.
The second mistake is mixing different market populations. A dataset covering one-to-four-unit residential properties should not be combined with a commercial or multifamily origination series unless the methodology explicitly supports that aggregation. Likewise, first-lien mortgages, junior liens, and home-equity products may have different definitions across sources.
The third mistake is treating estimates as confirmed historical data. Forecasts can be revised, and recent observations may also be subject to revisions. A professional chart should preserve the status of each observation and identify the source date whenever that information is important.

Another common error is calculating a simple average when a weighted average is required. If the purpose is to determine the average loan balance, dividing total dollars by total loans is generally more appropriate than taking the average of several already-averaged loan sizes. The correct calculation depends on the question being answered.
Quality-control checks before publishing
Before publishing a chart, check that purchase plus refinance equals total volume wherever the source definitions make that relationship valid. Differences caused by rounding should be documented rather than silently corrected. If other-purpose loans are included, make sure the components reconcile to the stated total.
Next, inspect the time series for unexpected jumps. A large movement may be real, but it may also result from a methodology change, revised historical data, a unit conversion, or a missing period. Compare unusual observations with the original source before presenting them as market events.
Finally, inspect the chart visually at its final publication size. Axis labels should remain readable, forecast boundaries should be obvious, and the legend should not obscure data. A technically correct chart can still fail as communication if the reader has to decode its structure.

Practical Solution
Start by defining the exact metric before opening a chart editor. Write one sentence such as: “This chart measures quarterly U.S. single-family mortgage origination dollar volume, separated into purchase and refinance loans.” That sentence becomes the analytical rule for the entire template. If a new source uses a different population, do not insert it until its definition has been reconciled.
Next, create a structured data area containing Period, Total Volume, Purchase Volume, Refinance Volume, Loan Count, Average Loan Size, Source, and Status. Calculate the selected-period average in a separate field. For a simple period average, divide the sum of valid observations by the number of observations. For average loan size, divide total dollar production by total loan count. Keep those two calculations visibly separate.
Then build the visualization around the decision the reader needs to make. Use stacked columns when composition matters, grouped columns when purchase and refinance need direct comparison, and a benchmark line when the historical average matters. Add a second chart for loan count if the dollar chart alone cannot explain the change. This two-view approach is often clearer than forcing every metric into one complicated graphic.

For recurring reporting, lock the definitions rather than merely locking the visual formatting. The template should tell future users what constitutes an observation, which periods are included in the average, which units are used, and how forecasts are marked. A consistent methodology is more valuable than a visually elaborate design because it allows charts from different reporting periods to remain comparable.
When the analysis is complete, create a presentation version that removes unnecessary analytical fields while retaining the source and methodology information required for interpretation. If the chart is intended for printing, use a restrained layout with large labels and strong contrast. If it will be embedded in a digital report, prioritize legibility at normal screen size rather than designing for a very large presentation display.
For users looking for an average mortgage origination volume chart template printable format, the best workflow is to build the analytical model first and create the printable view second. For users searching for an average mortgage origination volume chart template excel free structure, the essential requirement is still the same: a transparent dataset, visible formulas, and clearly defined units matter more than the software brand or file format.
How to adapt the template for reporting teams
A lender can use the structure to monitor internal production against a historical benchmark. A research team can use it to compare market cycles. A finance team can use it to connect origination activity with revenue and staffing assumptions. A management report can use it to show whether growth is coming from purchase lending, refinancing, loan-size changes, or a combination of these factors.
The same structure can also support scenario analysis. A base scenario might use a central forecast, while alternative scenarios can change purchase volume, refinance volume, or average loan size. Scenario values should remain clearly identified as assumptions. They should never be presented alongside historical values without a visual distinction.
A template can also be adapted to a lender’s internal portfolio by adding lender, channel, product, geography, and loan-purpose dimensions. The chart can then be filtered to show retail, broker, correspondent, conventional, government-backed, or other internally defined categories where the underlying source supports those classifications.
What current mortgage data shows about chart design
Recent public research reinforces the value of separating volume components. CFPB mortgage data published in 2026 provide monthly counts and dollar volumes, while MBA forecasts continue to distinguish purchase and refinance production. Fannie Mae forecasts also present purchase and refinance originations as separate components. These reporting practices are useful models for designing a template because they make the composition of total activity visible.
Long-run mortgage data also show why historical context matters. Federal Reserve HMDA research has documented substantial changes in purchase and refinance originations across multiple decades. Freddie Mac research shows similarly large changes in refinance activity across interest-rate cycles. A short chart covering only a few periods may therefore miss the market context needed to interpret an unusually high or low observation.
The strongest template is consequently not the one with the largest number of chart elements. It is the one that makes the source definition, time period, unit, average calculation, market composition, and forecast status easy to understand. That combination makes the visual useful for decision-making rather than merely decorative reporting.
Reference Examples
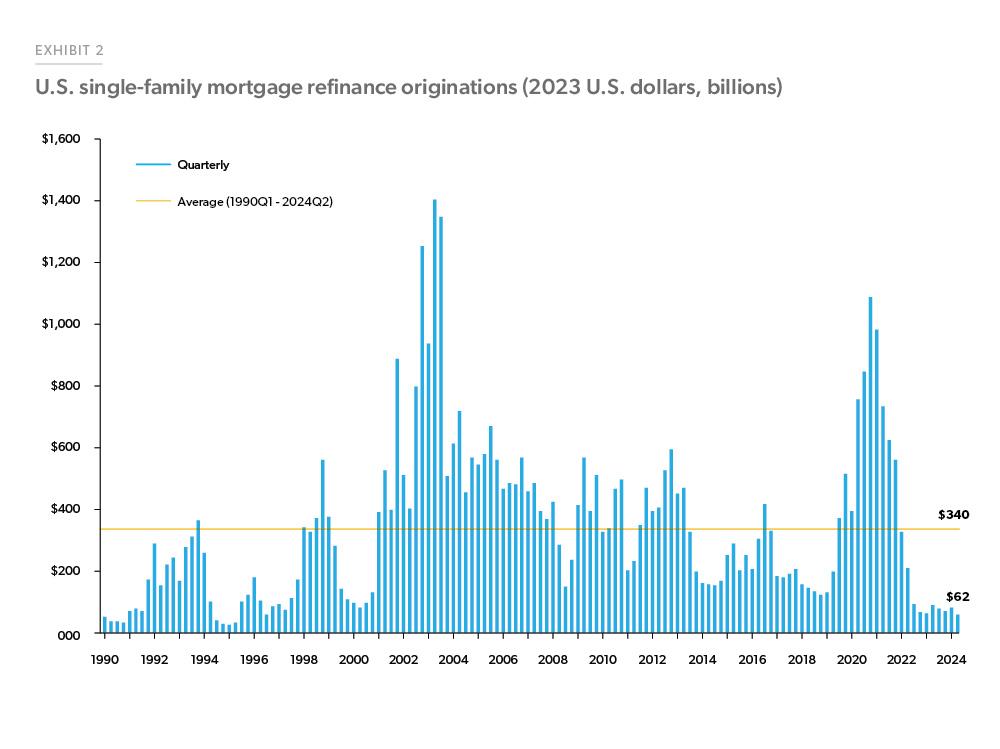
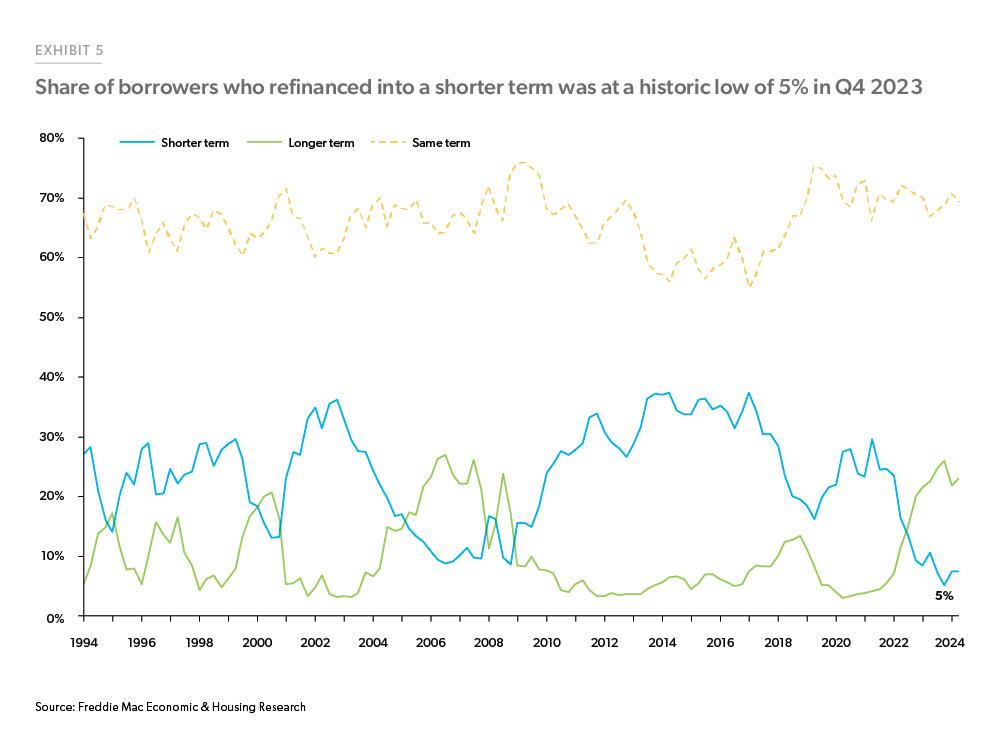
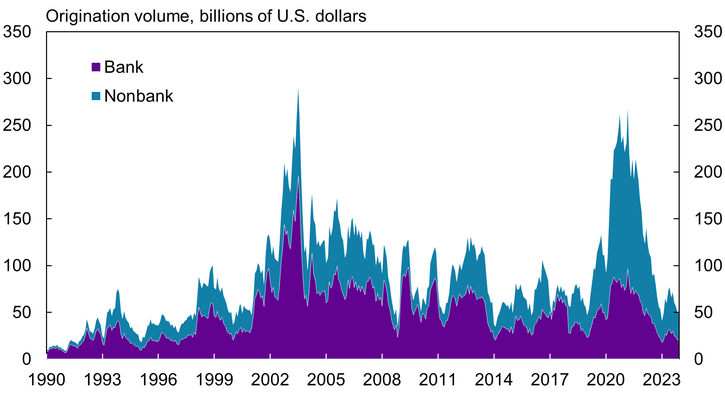
The following references show several ways mortgage origination activity can be visualized. An effective average mortgage origination volume chart Template can borrow structural ideas from these examples without copying their design. Notice how professional mortgage charts often separate purchase and refinance activity, identify the unit on the vertical axis, distinguish historical observations from forecasts, or add a benchmark line. These choices make the underlying calculation easier to interpret and help readers understand whether a change comes from loan count, loan size, refinancing conditions, or broader mortgage-market activity.
These visual references also demonstrate why chart context matters. A stacked bar can emphasize the composition of total production, while a line chart can emphasize a trend, and a benchmark line can show how a period compares with a historical average. Some examples focus on refinance behavior, others on total originations, and others on borrower or loan characteristics that influence the interpretation of mortgage production. Together they provide practical visual patterns for designing a consistent reporting framework.
U.S. Mortgage Originations by Quarter
Source: Cryptofalka
Mortgage Refinance Boom Dies Down as Rates Surge
Source: Statista

Original Loan Size of First-Lien Mortgage
Source: Federal Reserve Bank of Philadelphia
U.S. Single-Family Mortgage Refinance Originations
Source: Freddie Mac
Average UPB for Rate-Refinances
Source: Freddie Mac
Median Borrower Income for Refinances
Source: Freddie Mac
Mortgage Annual Payment Difference
Source: Freddie Mac
Annual Mortgage Originations (1-4 Units)
Source: New American Funding
