A business competition illustration Template is most useful when it does more than decorate a presentation. A strong template turns competitive information into a visual structure that helps readers compare rivals, recognize market positions, and understand why one offer may stand apart from another. Current template libraries commonly use comparison grids, competitive landscapes, market-share charts, ranking layouts, circular competitor diagrams, and positioning maps because these formats translate complex strategic information into a form that can be scanned quickly. The best design therefore begins with the decision the audience needs to make, not with colors or decorative graphics.
Search intent around this topic is usually practical. People are often looking for a ready visual structure for a business report, pitch, classroom project, strategy review, or market-analysis document. They may need a format that can be adapted to PowerPoint, Word, Google Docs, or another document workflow, or they may simply need a visual reference before creating their own layout. The important distinction is that a template should organize evidence rather than imply conclusions. Competitor names, features, pricing, positioning, market indicators, customer segments, and strategic differentiators should be based on verified information or clearly labeled assumptions.
Research into current business-presentation resources shows several recurring visual patterns. Competitive landscape slides frequently separate direct and indirect rivals, comparison matrices score multiple attributes, and benchmarking graphics place competitors against measurable dimensions. Other designs use a podium to communicate ranking or a circular model to show how competition interacts with customers, markets, products, vendors, and industries. These patterns are useful because each answers a different question. A matrix asks “how do the offers compare?”, while a landscape asks “where does each rival sit?” and a ranking asks “who leads on the chosen measure?”
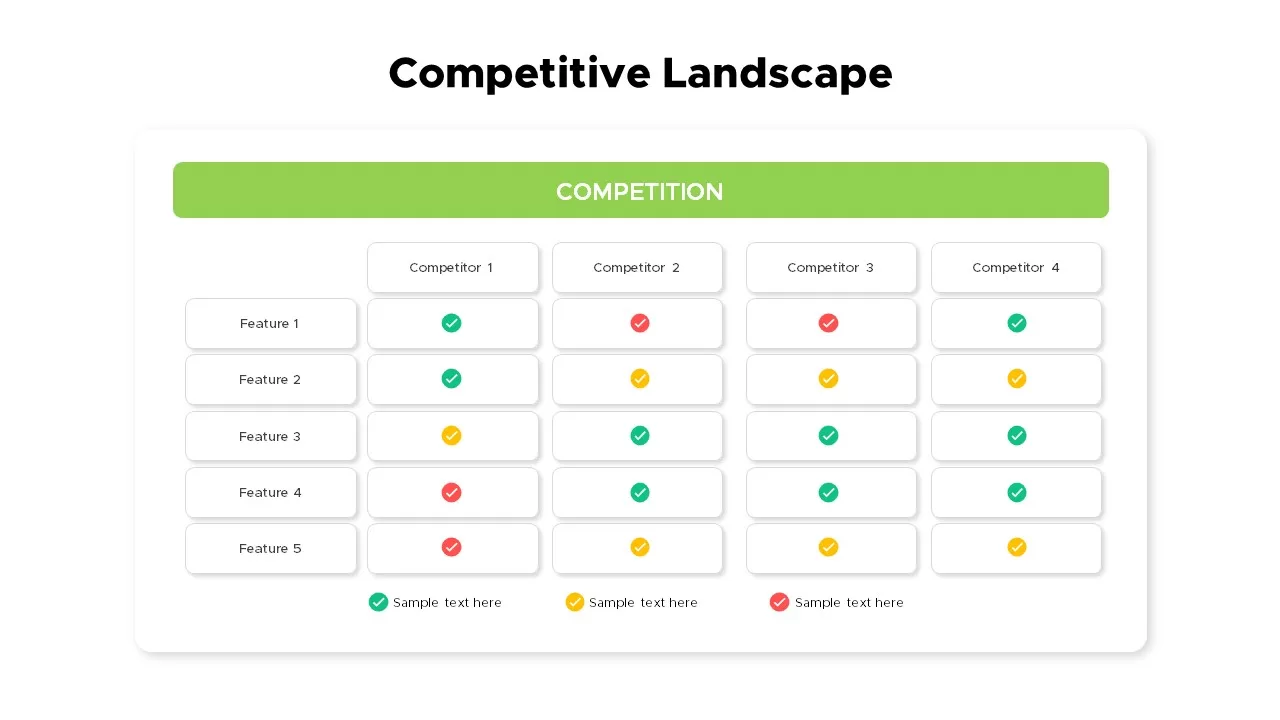
The central design principle is comparison clarity. A reader should be able to identify the company being analyzed, the relevant competitors, and the criteria used for comparison without decoding a complicated legend. This is why a business competition illustration template works best when each visual element has a defined analytical role. A colored column can represent a competitor, a row can represent a feature, and a symbol can represent presence, absence, maturity, or another explicitly defined condition. Consistency matters more than visual complexity.
Another important principle is evidence discipline. A polished chart can make weak information look authoritative, so every metric should have a traceable origin. If a presentation uses market share, pricing, customer counts, traffic, or revenue, the author should record the source, date, geographic scope, and measurement definition. If exact information is unavailable, use a qualitative label such as “high,” “medium,” or “low” only when the basis for that assessment is explained. Hypothetical values can be useful for demonstrating how a template works, but they should be identified as examples rather than presented as real market results.
Visual hierarchy also affects interpretation. The most important comparison should receive the strongest visual emphasis, while secondary details should remain subordinate. A useful template may place the company under review in a distinct column, use restrained colors for competitors, and reserve stronger contrast for the key differentiator. Excessive colors, icons, borders, or decorative illustrations can make a competitive slide harder to understand. The objective is not to make every element noticeable; it is to make the relationship among elements immediately understandable.

What a Business Competition Illustration Template Should Communicate
The first job of a template is to define the competitive field. Direct competitors usually offer a similar product or service to a similar customer group, while indirect competitors may solve the same underlying need through a different offering. Replacement threats can be even broader because customers may choose an alternative behavior instead of buying the category at all. A good visual structure leaves room for these distinctions rather than treating every rival as interchangeable.
The second job is to make comparison criteria explicit. Useful criteria depend on the business, but common dimensions include product features, pricing model, distribution, target audience, service quality, brand positioning, geographic reach, technology, customer experience, and perceived differentiation. The template should not encourage the author to collect every possible metric. A smaller set of decision-relevant measures is usually easier to interpret and more useful in a meeting than a crowded page containing dozens of disconnected observations.
The third job is to connect evidence with action. A competitive comparison becomes strategically valuable when the reader can see what the findings mean for positioning, product development, pricing, sales messaging, or market selection. For example, a feature comparison might reveal that several competitors offer similar core functions, suggesting that differentiation should move toward service, specialization, reliability, or distribution. The template should therefore reserve enough space for a short strategic interpretation rather than ending with raw comparison data.

Core Visual Formats for Business Competition
Comparison matrices
A comparison matrix is one of the most versatile structures because it supports direct side-by-side evaluation. The left side can contain criteria such as price, product quality, delivery, support, or features, while each competitor occupies a separate column. Symbols, scores, short phrases, or percentages can then be used to show differences. The strongest version of the matrix defines every scoring method before the data is entered, so that a checkmark does not accidentally imply a stronger result than it actually represents.
For a practical example, imagine a hypothetical software market with four vendors. Instead of assigning invented market claims, the author could compare verified product capabilities using a simple three-state notation: supported, partially supported, or not supported. A separate note can explain how each state was determined. This creates a useful illustration without pretending that the example represents actual market performance. The same structure can be adapted for a business case, classroom exercise, sales review, or strategic planning session.
A matrix is particularly effective when the audience already knows the competitors and needs a concise decision aid. It becomes less effective when there are too many companies or criteria. If a page becomes visually dense, divide the analysis into product, commercial, customer, and strategic views. This keeps each visual focused and makes it easier to explain the implications during a presentation.

Competitive landscape diagrams
A competitive landscape diagram is useful when the question is not simply who has which feature, but how companies occupy different positions in the market. Two axes can represent variables such as price and perceived quality, simplicity and capability, or specialization and breadth. Each competitor can then be represented as a point or labeled circle. The axes must be meaningful, and the basis for placing each company should be documented so that the visual remains analytical rather than subjective decoration.
Positioning maps are especially helpful when a market contains several clusters. If multiple companies occupy the same area, the visual can reveal potential crowding. If a large region appears sparsely populated, that may suggest a possible opportunity, although the empty space should never be treated as proof of demand. Market gaps still require customer research, feasibility assessment, and competitive validation. A template can reveal a hypothesis; it cannot validate the hypothesis by itself.
For presentation purposes, keep labels short and avoid placing so many competitors on the map that the points overlap. If the market is crowded, use a companion list or a second view that identifies the companies represented by numbers. This method preserves visual clarity while allowing the analysis to include a broader competitive set.

Market-share and performance charts
Charts are suitable when the competitive question depends on measurable performance. A pie or donut chart can show a distribution, while a line chart can show movement over time and a bar chart can compare discrete values. The most important rule is to label the measurement accurately. A chart about website traffic should not be described as market share, and a sample score should not be presented as revenue. Clear definitions protect the reader from drawing conclusions that the data does not support.
Time-series charts can be especially valuable because competition is dynamic. A company may show strong performance in a single snapshot but lose momentum over several periods. Conversely, a smaller competitor may show rapid movement from a low base. When using a time series, state the period, unit, and source. Avoid implying causation from a trend unless additional evidence supports the explanation.
When exact numbers are unavailable, the visual can use indexed performance or qualitative ratings, provided the methodology is explained. A normalized index can help compare trends across companies without claiming absolute market values. The template should make the method visible so that the audience understands what the chart measures and what it does not measure.

How to Structure the Information
Begin with the decision question. A template designed for a board review may focus on strategic threats and market positioning, while a sales presentation may focus on feature differences and objections. A student research project may need a clearer explanation of terminology and methodology. Defining the audience first prevents the common mistake of building a generic competitive slide that contains information but does not answer a practical question.
Next, define the competitor set. Include the companies customers genuinely consider, not merely the brands that are easiest to find online. Consider direct rivals, indirect alternatives, emerging entrants, substitutes, and established businesses expanding into the same customer problem. The suitable set depends on the market and the decision being made. It is also useful to record why each competitor was included so that the scope can be defended later.
Then define the evaluation criteria before collecting large amounts of data. A useful framework might contain company characteristics, target customer, product or service attributes, pricing, distribution, positioning, and evidence of customer response. Keep the criteria consistent across competitors. If one competitor has publicly available pricing while another does not, mark the missing information rather than filling the gap with an unsupported estimate.

After collecting the information, separate facts from interpretation. Facts include published specifications, stated prices, documented product capabilities, and other verifiable observations. Interpretation includes judgments such as “strong differentiation” or “high competitive pressure.” Both can belong in the same report, but they should not be presented as though they have the same evidentiary status. This distinction makes the template more credible.
Finally, create an implication layer. Ask what the comparison means for the organization using the template. The answer might be to strengthen a feature, narrow a target segment, revise a sales message, improve distribution, change a pricing structure, or investigate a market gap. The template becomes much more useful when every major visual leads naturally to a decision or a research question.
A good workflow can be summarized in a short sequence:
- Define the decision: determine what the audience must understand or decide.
- Map the competitive field: identify direct, indirect, emerging, and substitute alternatives where relevant.
- Select comparable criteria: use measures that are meaningful for the market and decision.
- Collect evidence: record sources, dates, definitions, and geographic scope.
- Normalize the presentation: use consistent units, labels, scales, and scoring rules.
- Interpret the differences: identify meaningful advantages, weaknesses, gaps, and uncertainties.
- Connect findings to action: translate observations into strategic questions or decisions.

Choosing Between Word, PowerPoint, PDF, and Google Docs Workflows
The phrase business competition illustration template free often signals a search for a low-cost starting point, but the more important question is whether the format fits the intended workflow. A document-oriented format is useful when the analysis needs detailed commentary, references, methodology, and supporting notes. A slide-oriented format is stronger when the goal is to explain the competitive picture quickly to an audience. A fixed document format can be suitable when the final artifact needs consistent pagination for review or printing.
Searches for business competition illustration template free download also reflect a practical desire to obtain a usable starting point quickly. However, a template should be evaluated for editability, licensing, visual quality, and suitability for the intended output before it is adopted. A visually attractive asset can still be a poor choice if its text areas are too small, its charts are difficult to modify, or its licensing terms do not fit the publishing context.
For readers looking for business competition illustration template pdf, the key consideration is whether the PDF is meant as a final report, a printable reference, or a visual source for recreating a design. A PDF is generally strongest when layout consistency matters. For business competition illustration template word, the emphasis should be on paragraph structure, headings, explanatory notes, and data-entry areas. These formats serve different communication purposes even when they depict the same competitive information.

Queries such as business competition illustration template powerpoint and business competition illustration template ppt generally point toward slide-based communication. In that setting, use one dominant visual per slide, keep supporting text concise, and move methodological detail into speaker notes or a companion report when suitable. The goal is to let the audience understand the competitive relationship before asking them to absorb the supporting explanation.
For business competition illustration template google docs, the most useful method is usually a document structure that combines a concise visual with explanatory paragraphs. Google Docs-style workflows work well when several contributors need to review wording, sources, assumptions, and findings together. For readers searching for business competition illustration template free pdf, the same principle applies: confirm that the resource is legitimate, suitable for the intended use, and actually contains the format described rather than assuming that a search-result label guarantees a particular file.
When comparing formats, do not treat file type as the main design decision. The content hierarchy should come first, followed by the audience, the amount of evidence, the need for editing, and the final delivery method. The same competitive model may be presented as a one-page matrix, a multi-slide story, or a longer report. The best format is the one that allows the reader to understand the evidence and its implications with the least unnecessary friction.

Designing Illustrations Without Losing Analytical Meaning
Illustration can make a competitive topic easier to understand, but the metaphor should match the analytical message. A tug-of-war suggests rivalry over a shared objective. A podium suggests ranking. A race suggests relative progress or speed. A circular diagram suggests relationships among multiple forces. These metaphors are useful because they provide immediate context, but they should be paired with explicit labels so that the audience does not have to guess what the artwork means.
Color can also encode meaning, but it should be used consistently. For example, a company under review can have one stable color while competitors use another family of tones. A risk can be separated from an opportunity, or verified values can be distinguished from assumptions. Avoid relying only on color when the presentation may be printed or viewed by people with color-vision differences. Labels, symbols, and position should reinforce the same distinction.
Typography should support scanning. Use a clear hierarchy between the main title, section labels, competitor names, criteria, and annotations. Keep chart labels large enough to read at the intended viewing distance. A presentation slide that looks impressive at full-screen resolution can fail in a meeting if the audience cannot read the small text from the back of the room.

Researching the Competition Before Filling the Template
Research should start with primary or otherwise authoritative evidence whenever possible. Company websites can help establish product features, published pricing, positioning statements, and service descriptions. Regulatory filings, official reports, reputable industry sources, and clearly documented market research can add context. Customer reviews and public discussion can provide qualitative signals, but they should be treated as one evidence stream rather than a complete representation of customer sentiment.
Record evidence in a structured research sheet before transferring it into the visual template. Useful fields include competitor, source, URL, publication date, observation, metric definition, geographic scope, confidence level, and notes. This makes later updates easier and reduces the risk of mixing information from different periods. It also makes it easier to explain why a particular competitor was placed in a particular position on a map or given a particular qualitative assessment.
Be especially careful with market-share claims. Market share can vary by geography, product category, revenue versus unit volume, customer segment, and time period. A percentage without those definitions can be misleading. If sources disagree, do not simply choose the figure that supports the preferred narrative. Explain the discrepancy, select a defensible source, or present a range when appropriate.

A template can also be tested against a compact scoring view. The purpose is not to make every competitor look equivalent, but to expose the criteria that matter most to the decision. Visual scoring is most useful when the legend and scoring method are explicit.


SWOT-style structures can supplement competitive comparisons when the analysis needs to connect internal capabilities with external pressure. The visual should remain focused on the business question rather than becoming a generic strategy diagram.


Digital visibility can become part of competitive research when it influences customer discovery. Charts should distinguish traffic, search visibility, public relations, and market share so the audience does not confuse different measurements.


Ranking visuals can be useful when the comparison has one declared criterion. If several criteria matter, show separate rankings or a balanced matrix rather than forcing every dimension into a single order.


A competitor traffic view can support a broader analysis when the underlying measure is clearly defined. The design should make the period and comparison basis easy to identify.


Competitive intelligence benefits from a systems perspective. Customers, markets, products, vendors, industries, and rivals can be shown together when the goal is to explain how competitive pressure is connected.


A matrix can make a crowded market easier to inspect because every competitor is judged against the same row definitions. The structure is especially useful when a presentation must compare several offers without lengthy prose.
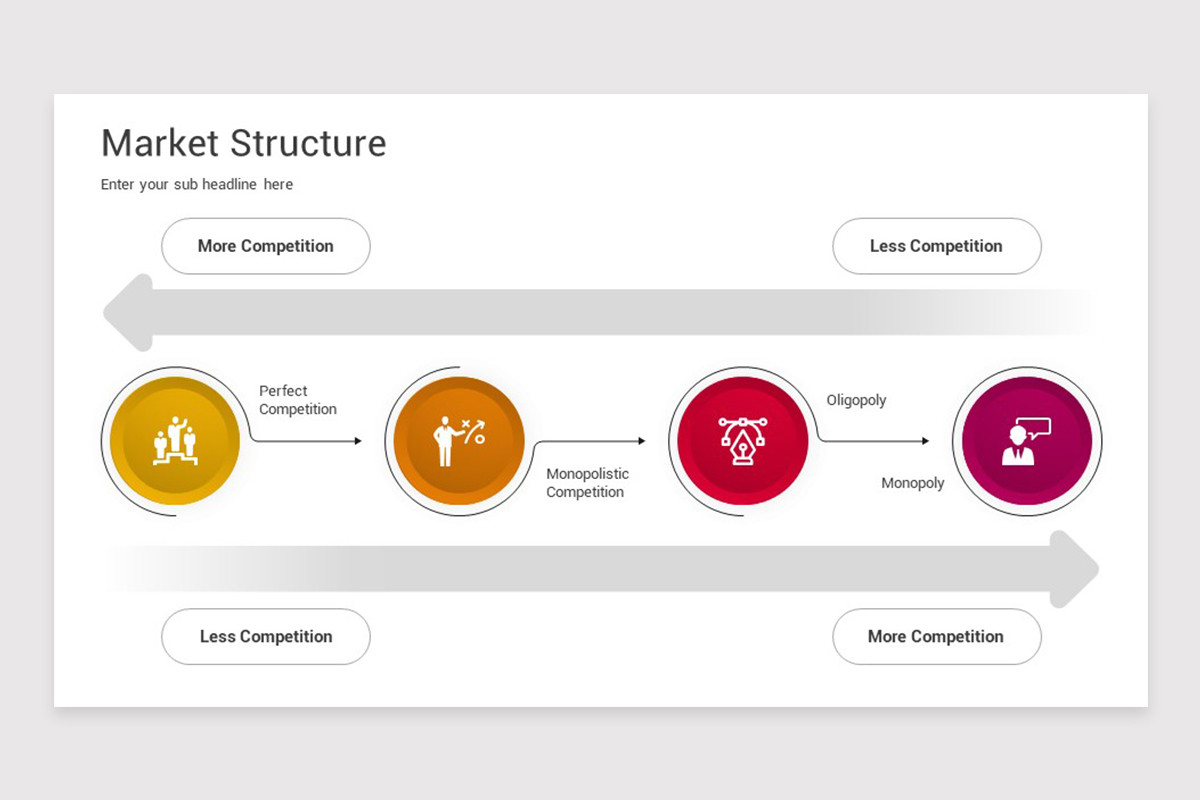

Supporting diagrams can also clarify how a company offering differs from alternatives. These visuals work best when every icon or symbol represents a defined business criterion rather than decoration.
Market-structure and ranking visuals provide additional context for the competitive environment. They should be treated as explanatory models, not as evidence of a particular company’s performance unless the underlying data has been verified.
Illustration Art Contests and Competition-Oriented Visual Research
Visual research can also matter when a business competition illustration template is being developed for a creative brief or a design-led project. Searches for illustration art contest examples can help designers study how different compositions communicate a theme, although contest artwork should be treated as inspiration rather than as material to reproduce. The useful lesson is usually about composition, visual metaphor, hierarchy, and storytelling rather than copying an individual artist’s execution.
The phrase communication arts illustration competition can similarly point readers toward professional illustration contexts where concept, craft, originality, and communication are evaluated together. For a business template, the practical takeaway is that illustration should serve a communication objective. A strong visual can clarify a competitive relationship, but it should not obscure the data or create a misleading emotional impression about a competitor.
When researching illustration art contest categories, readers may encounter distinctions based on editorial, advertising, institutional, book, product, surface, or personal work, depending on the particular competition. These categories demonstrate an important design principle: context changes what counts as an effective illustration. A business competition visual should therefore be judged by whether it communicates business rivalry and comparison clearly, not merely by whether it looks visually impressive.

Rules also matter when creative work is submitted to a contest. Searches for illustration art contest rules should always be checked against the official rules of the specific competition because eligibility, file specifications, originality requirements, rights, deadlines, and category definitions vary. A general design article cannot substitute for official contest conditions. For a business template, the same principle applies to licensing: verify the actual terms attached to an asset before using it in a commercial or public-facing project.
Common Mistakes When Building a Competition Illustration
One common mistake is confusing competition with simple comparison. A list of competitors is not yet an analysis. The visual becomes useful only when it explains a relationship, such as which features differentiate the offers, where the companies are positioned, how performance changes, or what customer need each competitor addresses. Without that relationship, the page may contain a lot of information while producing little strategic insight.
Another mistake is mixing metrics that cannot reasonably be compared. Revenue, traffic, unit sales, customer count, and market share are different measures. They can appear in the same report, but they should not be placed on a single scale without a clear methodological reason. Similarly, a qualitative score should not be displayed beside precise financial figures in a way that suggests they have the same statistical meaning.
A third mistake is overcrowding. When a template contains too many competitor names, colors, icons, metrics, and paragraphs, the audience loses the hierarchy. The solution is usually not smaller text. It is better selection. Move secondary detail to another visual, a supporting document, or research notes, and keep the main illustration focused on the question the audience needs to answer.

Practical Solution
The most practical way to create a reliable business competition illustration template is to build it as a reusable decision framework rather than as a decorative page. Start with a one-sentence objective such as “compare our offer with the three alternatives most likely to influence the purchase decision.” Then select four to seven criteria that directly support that objective. Create a consistent competitor column structure, define every symbol or score, and reserve a clearly labeled area for evidence or source notes.
Next, create two layers of content. The first layer is the factual comparison: features, pricing, distribution, positioning, market indicators, or other verified observations. The second layer is interpretation: what the comparison suggests, what remains uncertain, and what should be investigated next. This separation allows the visual to remain concise while preserving analytical honesty. If a number is hypothetical for demonstration purposes, label it as an example instead of allowing the reader to mistake it for a real market statistic.
Finally, test the template with a realistic use case. Ask someone unfamiliar with the research to identify the competitors, the comparison criteria, the strongest differences, and the main implication within a short viewing period. If they cannot do so, simplify the hierarchy before adding decoration. A successful template should make the evidence easier to understand, not merely make the page look more professional.
- Use a clear title: state what is being compared and, when useful, the market or period.
- Limit the main comparison: show only the criteria that matter to the decision.
- Define symbols: explain checkmarks, ratings, scales, colors, and indexed values.
- Keep sources traceable: retain research notes even when the main visual is concise.
- Separate facts from judgment: make assumptions and interpretations visibly distinct from verified observations.
- End with an implication: identify the strategic question, action, or next research step created by the comparison.

A strong reusable template can then be adapted for different audiences without changing its underlying logic. A strategy team might emphasize market positioning and competitive threats, a sales team might emphasize product differences and objections, and a research report might emphasize evidence and methodology. Keeping the structure consistent while changing the emphasis makes competitive analysis easier to update over time.
The final quality check should ask whether every visible element earns its place. Remove decorative elements that do not clarify competition, replace unsupported claims with clearly labeled assumptions, and verify that every metric has a definition. If the template communicates who competes, how they differ, where uncertainty remains, and what the organization should investigate or decide next, it has achieved its practical purpose.
Reference Examples
A business competition illustration Template works best when readers can see how competitive information is transformed into a visual structure. Useful references include comparison matrices, competitor maps, market-structure diagrams, ranking layouts, and strategic frameworks. These examples show different ways to organize the same broad subject: who competes, what they offer, how they differ, and what forces shape the market. When reviewing a visual reference, focus on its information hierarchy, labeling, scale, evidence structure, and use of visual metaphor rather than simply copying its appearance. A strong reference should help clarify the design decision behind the template.
The following references provide additional visual context for evaluating a business competition illustration Template . They include examples of competitor comparison, market structure, strategic positioning, ranking, and rivalry. Use them to compare layouts and understand how different visual systems communicate competitive relationships. Because template licensing and contest conditions can differ by source, the original publisher should be checked before any reuse or adaptation. The purpose of these references is to support informed design choices and help readers recognize which visual format best matches their own business-analysis objective.

Google Competitor Market Share Analysis
Source: SlideTeam

Competitive Analysis Framework
Source: Mykpono
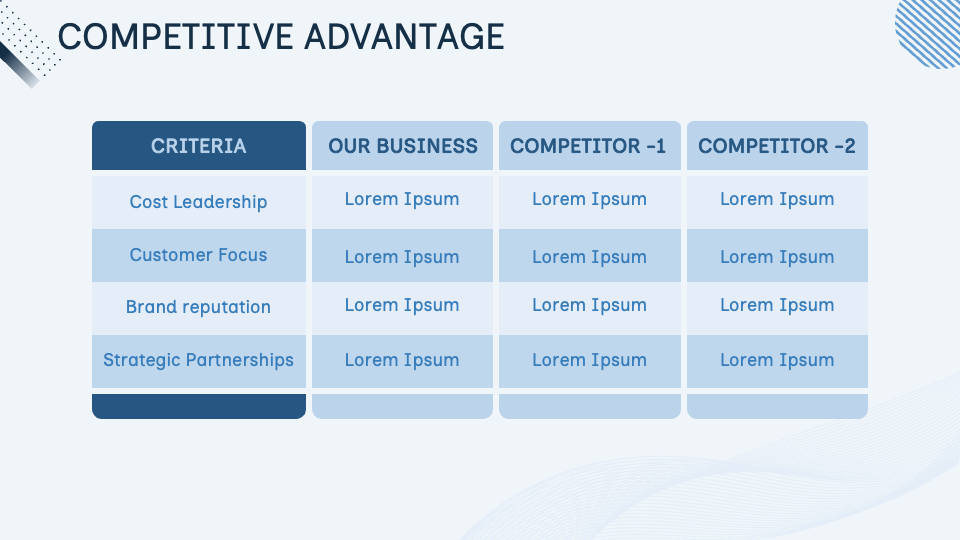
Competitive Advantage Comparison Slide
Source: Collidu

Competitor Analysis Infographic
Source: Canva

Types of Business Competition
Source: WSI World

Business Growth Competition And Success Slide
Source: SlideTeam

Branchenstrukturmodell-Five-forces.svg
Source: Wikimedia Commons
Business Competition Slide
Source: PoweredTemplate
KPPU Commission Members, 2024–2029
Source: Komisi Pengawas Persaingan Usaha
004 Business competition – New Zealand ferry lines Bluebridge and Interislander in Picton Harbor
Source: Wikimedia Commons
